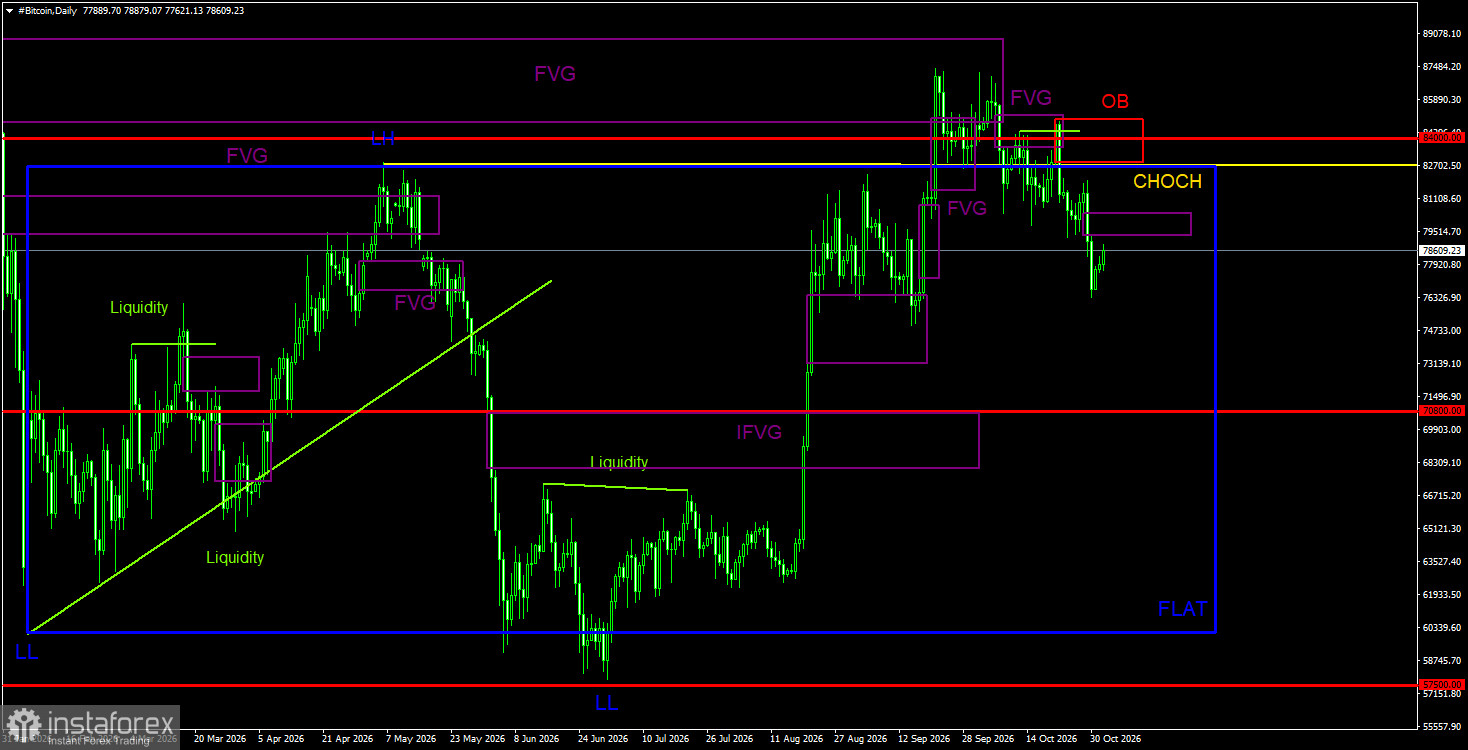
Bitcoin continues its decline, which could develop into a full-blown crash. Over the past several weeks, Bitcoin has lost roughly $10,000 in value, which is significant. For now, the move still looks corrective, but Bitcoin is steadily sliding lower. Recall there is a non-negligible chance the downtrend has already ended. However, the case for a new sustained "bull" trend remains unclear and contested. The recent three-month rally was essentially a move from the lower boundary of the daily sideways channel to the upper boundary after a lower-edge deviation and then an upper-edge deviation formed. The upper-edge deviation was deep; if it was indeed a deviation, Bitcoin could head toward $70,800. The price has now moved back into the sideways channel, so a move to the channel's 50% midpoint would be both natural and logical.
The new sell-off in Bitcoin and the wider crypto market was triggered by the hack of Binance, which resulted in the theft of about $6.4 billion — the largest theft in the crypto sector's history. In addition, Bitcoin faces another major challenge this week. Tomorrow, November 3, the U.S. midterm elections take place, and historically Bitcoin has declined following midterms over the past 12 years — in some cases by tens of percent. Furthermore, Democrats are widely expected to win, which could reduce Bitcoin's popularity among investors. Recall that Donald Trump had pushed to position the U.S. as a crypto hub; with Democrats in power, the Clarity Act and similar initiatives would likely lose momentum. Investors are already nervous: threats to wallet and network security are rising month by month.
Given these developments, we still do not see a fundamental basis for a long-term Bitcoin bull market.
General picture of BTC/USD on 1D
On the daily timeframe, the downward trend structure is broken, so most likely "digital gold" has officially moved into forming a new bullish trend. The price worked off the bearish FVG from the prior trend, reacted to that pattern, and a correction began as expected. However, the September breakout beyond the $60,000–$82,500 sideways channel may still be a deviation which, combined with the reaction to the bearish FVG, could trigger a drop toward the lower boundary of the sideways channel. Another sell signal formed inside the last bearish FVG. In addition, bearish order blocks and FVGs have formed that point south and could generate new sell signals.
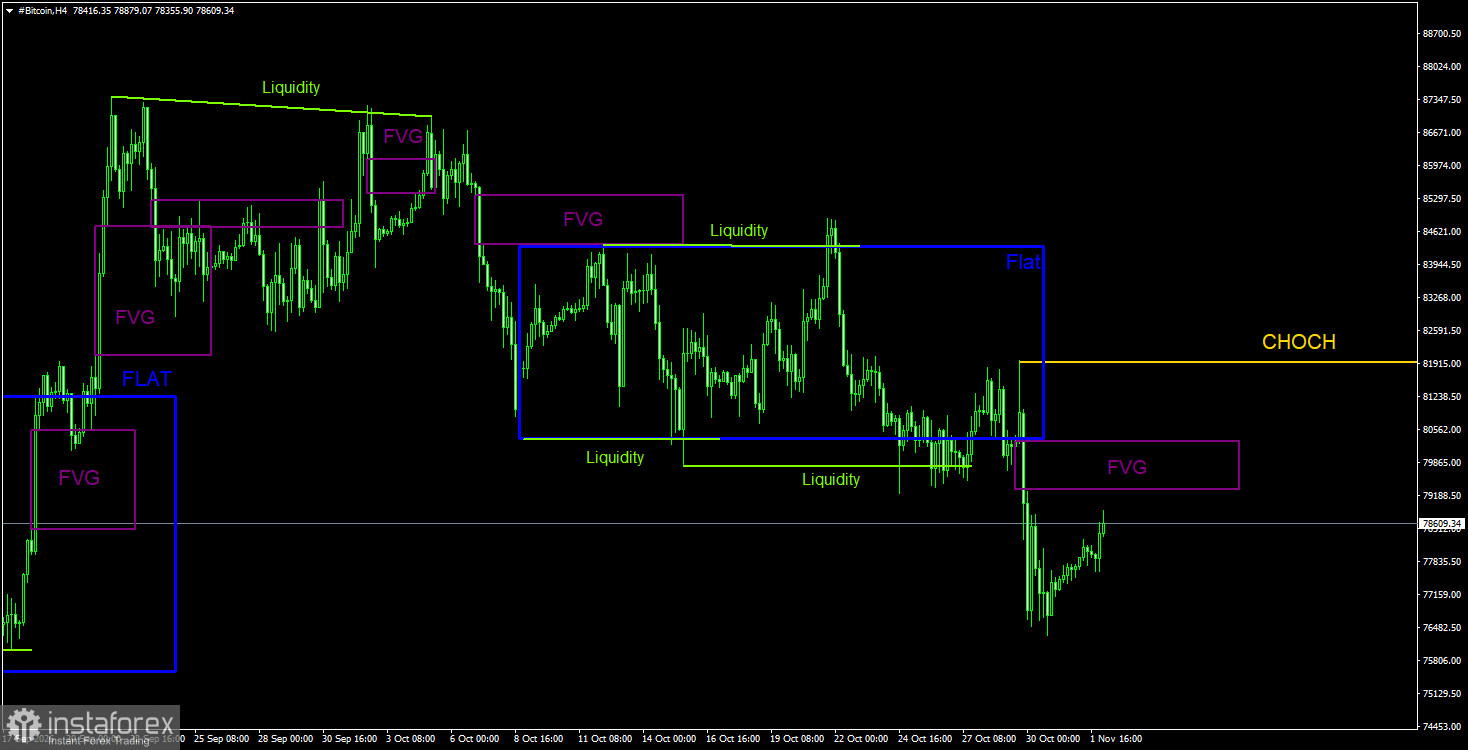
General picture of BTC/USD on 4H
On the 4-hour timeframe, a downward structure continues to form. The CHOCH line is currently at the $82,000 level. On the daily TF, all necessary reversal signals to the downside were received, allowing traders to open short positions. Bitcoin's targets are best determined by the daily sideways channel, which we regard as still relevant. On the 4-hour TF, Bitcoin has left the sideways channel, as we anticipated. Thus, in the near term, traders can use local bearish patterns to open short positions. One such pattern is the most recent bearish FVG.
Trading recommendations for BTC/USD
Bitcoin tried to start a new bullish trend, but the fundamental backdrop, spot demand, and recent news are too weak to expect its continuation. In the near term, on the daily TF, Bitcoin may decline as price reacted to the last two bearish FVGs and formed a bearish order block. The breakout beyond the daily sideways channel is currently viewed as a deviation. Thus, Bitcoin has produced a reversal signal and taken aim at the $70,800 level. Because a flat does not guarantee the end of the primary trend, we do not believe the bearish trend is finished. Short positions are the most relevant in the near term.
Notes on the illustrations:
- CHOCH — change of the market structure (trend break).
- Liquidity — liquidity areas, Stop Losses, and pending orders that market?makers use to build their positions.
- FVG — fair value gap (a price-inefficiency zone). Price often moves quickly through such areas, indicating the absence of one side of the market; later price tends to return to these zones and react in the direction of the main trend.
- IFVG — inverted fair value gap. After a return to such a zone, price does not react to it but impulsively breaks through and then tests it from the other side.
- OB — order?block. The candle where a market-maker opened a position to capture liquidity and subsequently establish a position in the opposite direction.