

empty
03.11.2026 12:06 PM
Oil on November 3: An Analysis of the Downward Trend and Potential Rebound Zones.

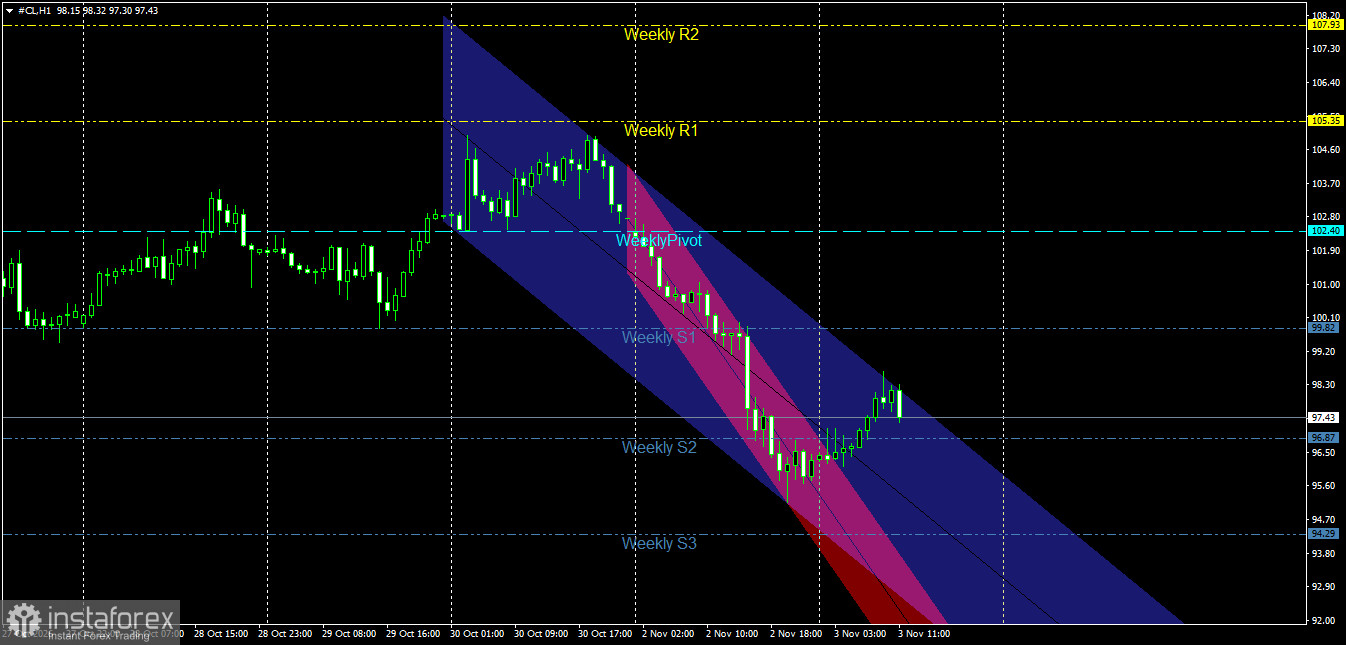
The one-hour (H1) chart for crude oil futures (#CL) displays dynamic price action, reflecting a short-term corrective downtrend. The price is currently interacting with the boundaries of a descending price channel, as well as weekly pivot points, support, and resistance levels. This chart provides a precise understanding of current market strengths and weaknesses, offering a basis for developing future investment strategies.

First: Technical Analysis of the Current Situation.

This image is no longer relevant

Descending Price Channel:

Following a rally to highs near the 107.30 and 108.20 levels in late October 2026, the price entered a sharp sell-off phase, forming a clear descending price channel (illustrated in blue and purple).

The price is currently trading at 97.43, attempting to stabilize within the upper portion of this channel—or retest it—following a recent rebound from lows near the 95.60 level.

Weekly Pivot Points, Support, and Resistance:

Weekly Pivot: Located at 102.40, this serves as a key threshold and a primary directional benchmark; as long as the price remains below this level, the bearish outlook persists.

Resistance Levels: The first weekly resistance (Weekly R1) is situated at 105.35, while the second weekly resistance (Weekly R2) lies at 107.93. Support Levels: The first weekly support (Weekly S1) is located at 99.82—a level that has been broken to the downside. The second weekly support (Weekly S2) sits at 96.87, which served as a temporary rebound base, followed by the third weekly support (Weekly S3) at 94.29.

Price Action:

Recent sessions have seen an accelerated decline, moving past the pivot point and the first support level toward the second support zone near 96.87. This was followed by a minor corrective rebound, bringing the price to its current level of 97.43—a point where it is retesting the downward trendline or the channel's midline.

Second: Expected Scenarios.

Scenario One (Bearish/Corrective Continuation):

Should the price fail to break through the nearby resistance or the upper trendline of the descending channel—while continuing to trade below the pivot point of 102.40—selling pressure is likely to intensify.

This scenario targets a retest of the second support level at 96.87. A clear break below this level could lead the price directly toward the third weekly support (Weekly S3) at 94.29, and subsequently toward the lower boundary of the channel.

Scenario Two (Bullish Corrective Rebound):

If buyers succeed in capitalizing on the current rebound from the 96.87 zone and manage to break above the upper trendline of the price channel, we may see a deeper corrective wave. This upward wave aims to retest the weekly pivot level at 102.40—a critical test that will determine whether the market has the capacity to shift its short-term trend.

On the hourly timeframe, the technical outlook for crude oil remains negative and bearish, provided the price stays below the key resistance level—the weekly pivot—at 102.40. The current rebound should be viewed as a technical correction within the broader downtrend; it is advisable to closely monitor how the price reacts to nearby support and resistance levels to avoid being caught in sharp, volatile swings.

Price Status on the Daily Chart and Expected Movement:

This image is no longer relevant

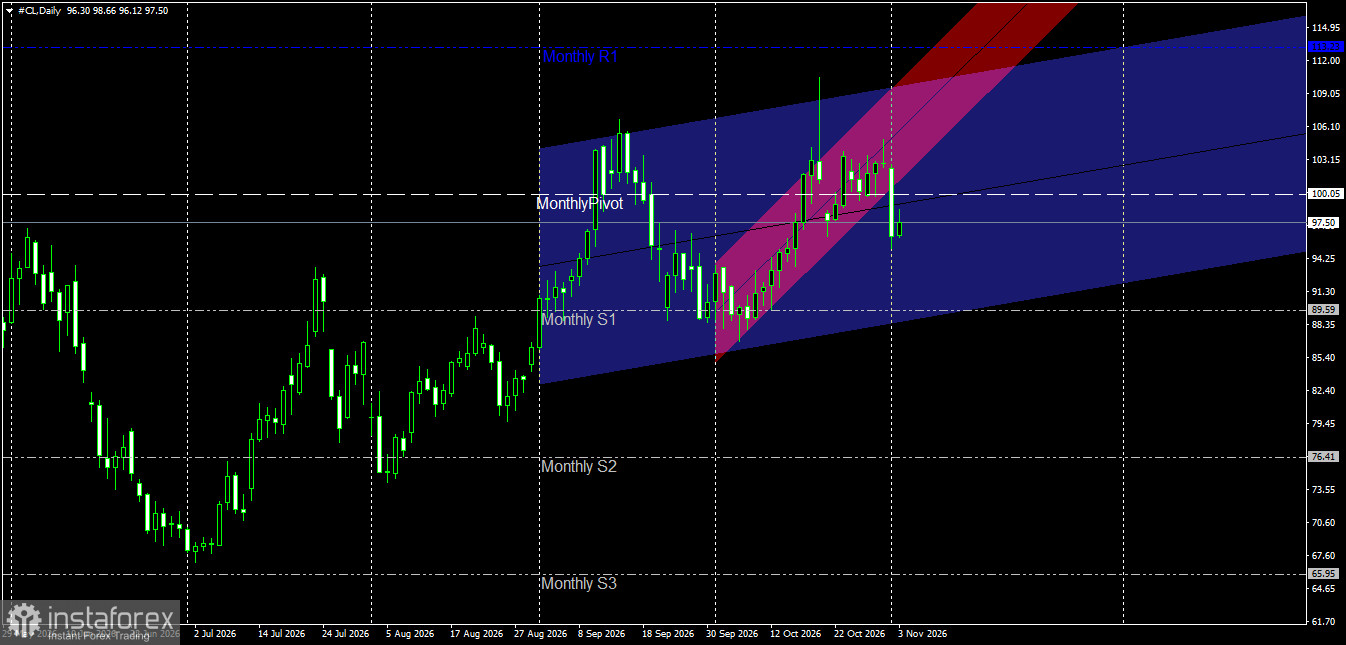
Current Price Status: Crude oil is trading within an ascending price channel; however, it is currently under downward corrective pressure, bringing it to the lower boundary of the channel and a nearby support zone at the 97.50 level. It is currently positioned below the monthly pivot point at 100.05.

Expected Movement:

Should the price successfully rebound and stabilize above the current support level and the lower boundary of the channel, an upward resumption is expected, targeting the monthly pivot point at 100.05, followed by the first monthly resistance level (Monthly R1) at 113.23.

Conversely, if the price breaks below the lower boundary of the channel and the current support level, the decline may extend toward lower levels, testing the area near the first monthly support level (Monthly S1) at 89.59.

Nermin Ezzeldin,
Especialista em análise na InstaForex
© 2007-2026
Ganhe com as variações das taxas das criptomoedas com a InstaForex.
Baixe o MetaTrader 4 e abra a sua primeira operação.
  • Grand Choice
    Contest by
    InstaForex
    InstaForex always strives to help you
    fulfill your biggest dreams.
    PARTICIPE DO CONCURSO
  • Chancy Deposit
    Deposite US $ 3.000 em sua conta e receba $5000 mais!
    Em Novembro nós sorteamos $5000 na campanha Chancy Deposit!
    Tenha a chance de ganhar, depositando $3,000 em sua conta de negociação. Após cumprir essa condição, você se torna um participante da campanha.
    PARTICIPE DO CONCURSO
  • Trade Wise, Win Device
    Abasteça a sua conta com pelo menos $500, inscreva-se no concurso e tenha a chance de ganhar dispositivos móveis.
    PARTICIPE DO CONCURSO
  • Bônus de 30%
    Receba um bônus de 30% toda vez que você fizer um depósito em sua conta
    RECEBA O BÔNUS

Recommended Stories

Não pode falar agora?
Faça sua pergunta no chat.
Widget callback