

empty
02.11.2026 12:23 PM
Gold on November 2: a sharp decline and complete dominance of the negative trend

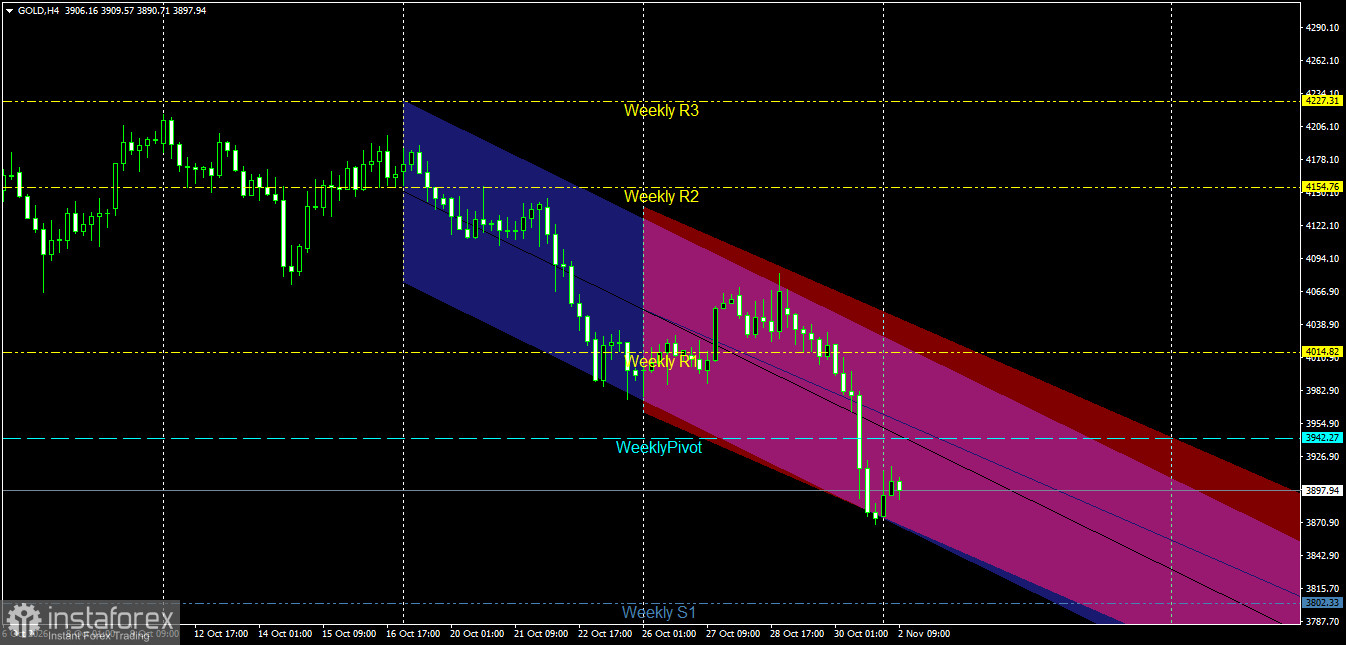
The 4-hour chart (H4) of the gold symbol (GOLD) shows negative price performance characterized by an accelerating decline and intensifying selling pressures; The price is currently trading at 3897.92 levels, recording a clear break of many technical support levels and vital pivot levels, which reflects the clear dominance of the selling forces and the bears' control over the short-term market movement.

Technical reading and price action.

This image is no longer relevant

Structure of price channels: The price moves within a wide main descending channel that reflects the general negative path, and is interspersed with a steep descending sub-channel that directly and effectively puts pressure on the price movement and pushes it towards successive new lows. It is noted that the price is currently positioned near the lower borders of these channels, amid slight fluctuation attempts to build a temporary support base near the current levels following the rebound from the recent local bottom recorded at levels close to 3889.80.

Interaction with the pivot and resistance levels: The price faced violent downward pressure after failing to hold the highest pivot levels represented by the Weekly Pivot point at 3942.27 and the upper resistance levels such as Weekly R1 and Weekly R2. As a result of these intense pressures, the price penetrated the support lines downwards to trade at the lowest pivot levels, aiming to gradually approach the first weekly support levels (Weekly S1) located at the lower levels.

Pivotal support and resistance levels.

Main resistance levels:

First resistance: level 3942.27 (the weekly pivot point and the dividing line of the intraday trend).

Second resistance: 4008.80 level (Weekly R1 resistance level and previous retracement areas).

Pivotal resistance: 4154.76 level (Weekly R2).

Main support levels:

First support: 3889.80 level (last intraday low and current retracement area).

Second support: 3802.33 level (the extended lower limit of the descending channels and the upcoming psychological support).

Main support: areas of 3771.65 and below in the event that the price collapse continues and selling momentum increases.

Price action forecasts and trading recommendations.

Bearish scenario (main):

The negative path is dominant and most likely as long as the price settles below the nearby resistance levels and the lowest weekly pivot point 3942.27.

Recommendation: It is preferable to sell with every upward corrective bounce towards the levels of 3920.00 - 3942.27 as long as you keep preventing prices from rising.

Technical objectives: targeting the break of the current support bottom at 3889.80, then extending towards the lower borders at 3802.33 levels.

Corrective bullish scenario (alternative):

It is activated if intense purchasing forces emerge that succeed in lifting prices from the current lows and breaching technical resistance levels.

Verification condition: 4-hour candle closes clearly above the weekly pivot level 3942.27.

Technical objectives: Opening the way for a deeper positive correction targeting 4008.80 levels and then approaching the second weekly resistance.

Gold Price on the Daily Chart:

This image is no longer relevant

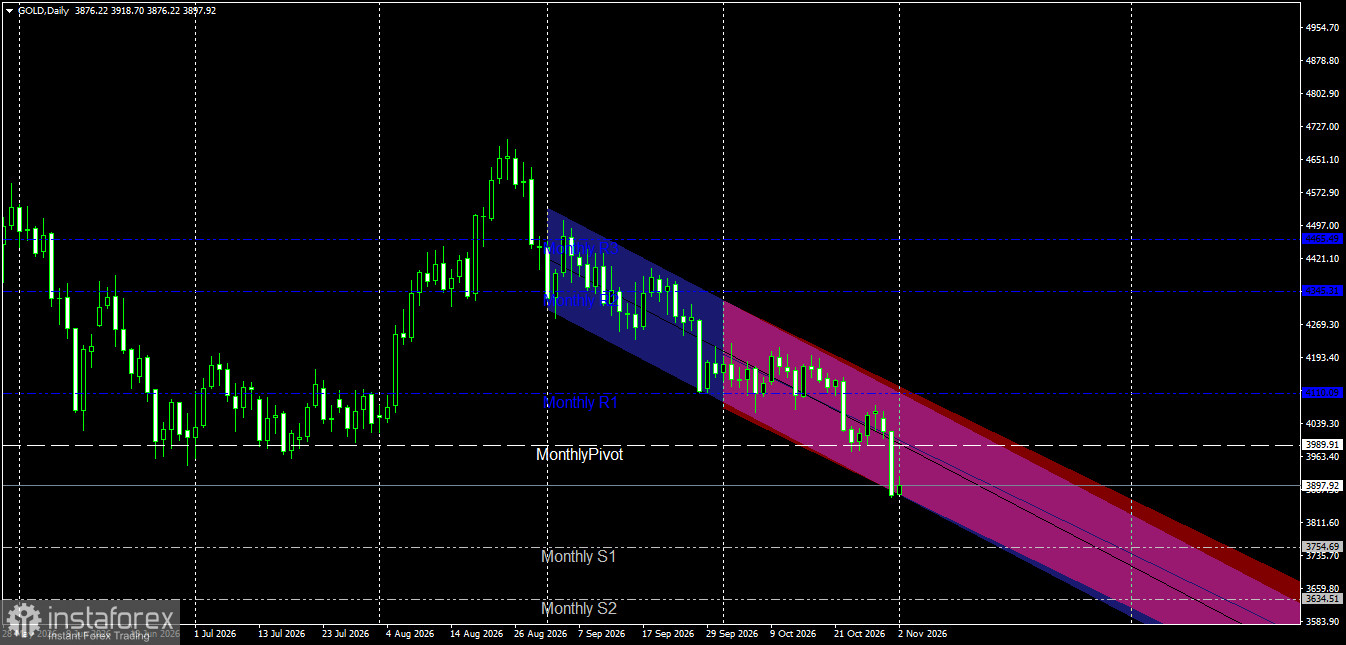
The price is currently trading at 3897.92 within a descending channel on the daily timeframe, reflecting a sharp decline and intense selling pressure as it remains below key pivot levels—specifically the monthly pivot point at 3989.91.

Analysis of the Last Two Candles:

Friday's Candle: This candle signaled a steep drop and immense selling momentum, breaking through previous support levels and pushing the price to test new lows near 3876.22.

Today's Candle: Shows minor attempts at consolidation near 3897.92, while the bears (sellers) remain in complete control within the descending channel.

Outlook for Future Movement:

Bearish Scenario (Primary): This remains the most likely outcome as long as the price holds below the monthly pivot point and nearby resistance levels. The decline could potentially continue, targeting the next monthly support level at 3754.69 (Monthly S1).

Bullish Scenario (Alternative): This would be triggered if significant buying pressure emerges, successfully lifting the price and initiating a corrective rebound toward nearby resistance levels.

Nermin Ezzeldin,
Especialista em análise na InstaForex
© 2007-2026
Ganhe com as variações das taxas das criptomoedas com a InstaForex.
Baixe o MetaTrader 4 e abra a sua primeira operação.
  • Grand Choice
    Contest by
    InstaForex
    InstaForex always strives to help you
    fulfill your biggest dreams.
    PARTICIPE DO CONCURSO
  • Chancy Deposit
    Deposite US $ 3.000 em sua conta e receba $5000 mais!
    Em Novembro nós sorteamos $5000 na campanha Chancy Deposit!
    Tenha a chance de ganhar, depositando $3,000 em sua conta de negociação. Após cumprir essa condição, você se torna um participante da campanha.
    PARTICIPE DO CONCURSO
  • Trade Wise, Win Device
    Abasteça a sua conta com pelo menos $500, inscreva-se no concurso e tenha a chance de ganhar dispositivos móveis.
    PARTICIPE DO CONCURSO
  • Bônus de 30%
    Receba um bônus de 30% toda vez que você fizer um depósito em sua conta
    RECEBA O BÔNUS

Recommended Stories

Não pode falar agora?
Faça sua pergunta no chat.
Widget callback